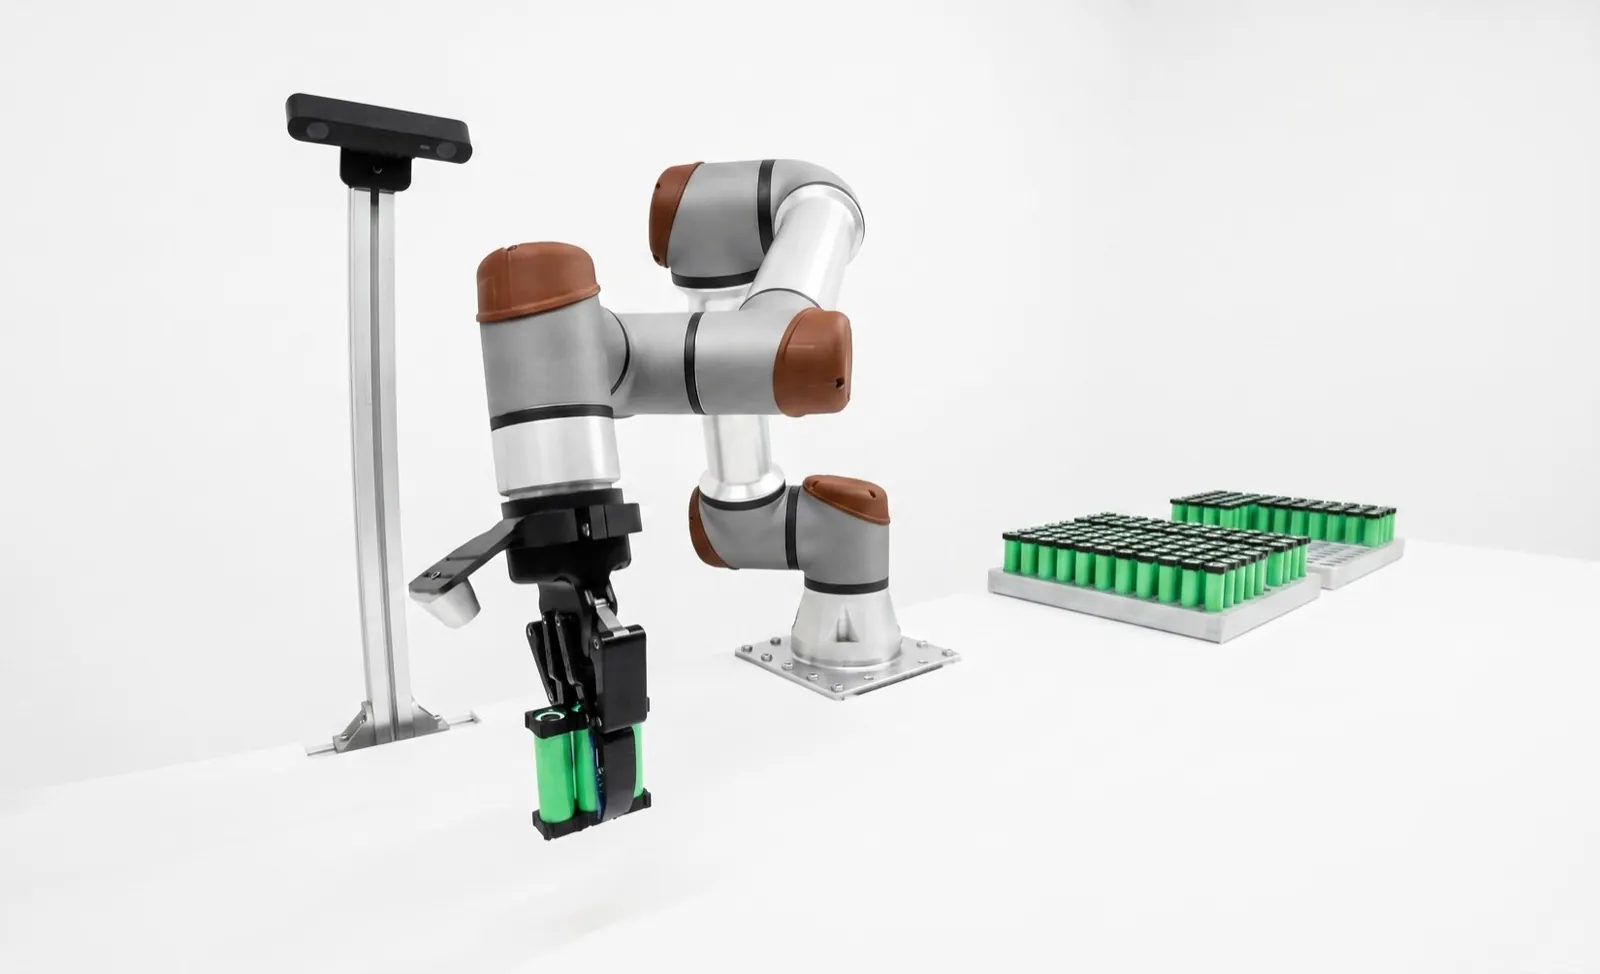
How to calculate machine vision ROI, with every number shown.
Machine vision ROI comes down to one comparison. What do manual inspection and escaped defects cost you each year, and what does the station cost to buy and run? Our worked example pays back in about a year, and a sloppy false-reject rate adds five months to that.
On this page
To calculate machine vision ROI, add up the yearly savings the station creates, subtract the new yearly costs it brings, and divide the full project cost by what's left. Times 12, that's your simple payback in months. The savings come from inspection labor, escapes, earlier scrap detection and sometimes throughput. The cost people forget is false rejects.
Below we show what to count, then work a complete example with every input on the table so you can swap in your own. If you haven't priced the station yet, start with our machine vision system cost guide. The example here is illustrative. It isn't a customer, and none of it is a Relling deployment result.
Key takeaways
- Simple payback is project cost divided by net annual savings, times 12.
- Count only the inspection hours the station actually frees, at a loaded labor rate.
- Escapes are usually the biggest lever, so price them from your own complaint records.
- False rejects are a running cost. In our example, 2 percent instead of 0.5 percent adds five months to payback.
- Write both the catch rate and the false-reject rate into acceptance.
How do you calculate machine vision ROI?
Payback in months equals total project cost divided by net annual savings, times 12. Net annual savings are labor freed, escapes avoided and earlier-detection savings, minus false-reject handling and upkeep. ROI over three years is cumulative net cash divided by project cost.
Keyence's own guide to AI inspection payback makes a point we agree with. The most common reason an ROI estimate disappoints is a weak baseline.6 The formula's easy. Knowing your real defect rate, your real escape cost and how good your inspectors actually are is the hard part, and that's what this post spends most of its time on.
What is a good payback period for machine vision?
Many manufacturers want inspection automation to pay back within 12 to 24 months, though that hurdle's a company decision, not a rule. Stations that replace a full manual inspection or stop costly customer escapes often clear it in about a year. Low-volume checks with cheap escapes may never get there.
Be suspicious of a vision payback quoted in weeks. It's usually counting a whole inspector's salary as saved when somebody still has to clear the reject bin, or it's pricing every escape like a recall. Our worked example lands at about 13 months with a ramp-up, and we think that's a more honest picture of a good station on a busy line.
What savings count toward inspection automation ROI?
Count inspection labor freed, escaped defects avoided, scrap and rework avoided by catching defects earlier, and throughput if inspection is the bottleneck. Only count a saving that someone in finance would recognize in the books, and price each one from your own records.
Labor's the one everybody starts with, and it's the one most often overstated. The station rarely frees a whole shift. Someone still reviews rejects, audits the camera and handles changeovers. Use a loaded rate, too. A3's long-standing cost-justification guidance notes that fully burdened direct labor can easily run 1.5 times the hourly wage.7 We use a slightly more conservative ratio from BLS data in the example.
Escapes are usually where the money is. A defect that reaches your customer costs sorting, freight, chargebacks and warranty, and sometimes the account. Late detection is the quieter one. A defect caught after plating or assembly has soaked up the cost of every step it went through, so a camera placed upstream saves that work. Data and traceability have value too, but they're hard to price. We list them and usually leave them at zero.
How does cost of quality apply to machine vision?
ASQ's cost of quality model splits quality spending into prevention, appraisal, internal failure and external failure. A vision station spends appraisal money to cut failure money, so it pays off when the failure costs it removes are bigger than what it costs to run.1
| ROI line | Cost of quality category | Direction | In our example |
|---|---|---|---|
| Manual inspection labor | Appraisal | Down | $50,040 a year saved |
| Escapes, chargebacks, warranty | External failure | Down | $33,600 a year saved |
| Scrap and rework from late detection | Internal failure | Down | $23,760 a year saved |
| False rejects | Internal failure, created by the station | Up | $8,910 a year added |
| Station, validation, upkeep | Appraisal, plus prevention where data feeds process control | Up | $95,000 once, $6,000 a year |
Look at the fourth row. A station that rejects good parts is creating internal failure cost, which is why false rejects belong in the ROI and not in a footnote. And if you don't track escape and scrap costs today, you're in good company. ASQ cites its 2025 cost of quality survey, where only 31 percent of respondents said they fully understand how quality costs hit financial performance.1 Building this business case is a decent excuse to start.
What does a machine vision ROI calculation look like?
Here's a complete illustrative case. One inspection station replaces most of a manual visual check on a two-shift line, costs $95,000 all in, and saves $92,490 a year net, for a simple payback of 12.3 months. Every input is listed so you can replace it with yours.
| Input | Value | Where it comes from |
|---|---|---|
| Annual volume | 1,200,000 parts | 300 parts an hour × 4,000 hours (2 shifts × 8 h × 250 days). Illustrative. |
| Incoming defect rate | 1.0% | 12,000 defective, 1,188,000 good parts a year. Illustrative. |
| Manual hit rate | 85% | In line with a Sandia study of precision parts inspectors.2 |
| Vision catch rate | 99% | A target written into acceptance and checked on a test set. Illustrative. |
| Cost per escape | $20 | Sorting, freight, chargeback and admin, averaged. Illustrative. |
| Inspection hours freed | 1,500 h a year | Of 2,000 h of manual inspection, 500 h stay for reject review and audits. Illustrative. |
| Loaded labor rate | $33.36 an hour | BLS median inspector wage of $23.353 ÷ 0.70, since wages are 70 percent of private-industry compensation.4 |
| Downstream cost avoided | $2 per defect caught | Station sits ahead of a plating or assembly step. Illustrative. |
| Vision false-reject rate | 0.5% of good parts | After tuning. Illustrative. |
| Cost per false reject | $1.50 | About a minute of review plus handling, and the part is recovered. Illustrative. |
| Recurring upkeep | $6,000 a year | Spares, software fees, job edits. Illustrative. |
| Project cost | $95,000 | $85,000 installed station plus $10,000 of internal engineering and install downtime. Illustrative. |
| Line | Calculation | Per year |
|---|---|---|
| Labor freed | 1,500 h × $33.36 | $50,040 |
| Escapes avoided | (1,800 manual escapes − 120 vision escapes) × $20 | $33,600 |
| Earlier detection | 11,880 defects caught upstream × $2 | $23,760 |
| Gross savings | Sum of the three lines above | $107,400 |
| False rejects | 0.5% × 1,188,000 good parts = 5,940 × $1.50 | −$8,910 |
| Upkeep | Spares, software, job edits | −$6,000 |
| Net annual savings | $107,400 − $8,910 − $6,000 | $92,490 |
| Simple payback | $95,000 ÷ $92,490 × 12 | 12.3 months |
The escape line works like this. Manual inspection misses 15 percent of the 12,000 defective parts, so 1,800 get out. The station misses 1 percent, so 120 do. That's 1,680 fewer escapes at $20 each.
Simple payback assumes full savings from day one, and no station does that. In the chart we run the first two months at half savings while the job's tuned and operators learn the reject bin. That moves the crossing to about 13.3 months, with about $175,000 of cumulative net cash by month 36. We left throughput and traceability at zero, so it's a conservative case for this line.
Which inputs change vision payback the most?
In this example the incoming defect rate moves payback the most, from 7.6 to 17.9 months, followed by project cost, escape cost and the false-reject rate. The vision catch rate barely moves it. A tornado chart like the one below shows which of your numbers need real data before anyone signs.
The defect rate sits on top because it scales both the escape savings and the early-detection savings. The surprise for most people is the bottom row. Whether the station catches 97 percent or 99.7 percent of defects moves payback by about a month, but the false-reject rate moves it by more than five. Everyone argues about catch rate in the demo. The line pays for the false-reject rate every single day.
The manual hit rate matters too, and it's the number plants overestimate most. Sandia's study found inspectors caught 85 percent of defective items and wrongly rejected 35 percent of good ones.2 That's one study on one kind of part, so measure your own people the way you'd test a camera. Run a labeled set past them blind. Our manual vs automated visual inspection post goes further into that comparison.
How do false rejects affect machine vision ROI?
Every good part the station rejects has to be reviewed, reworked or scrapped, so false rejects are a running cost that grows with volume. In our example they cost $8,910 a year at 0.5 percent, $35,640 at 2 percent, and at about 1.07 percent they wipe out the savings if the parts get scrapped.
What happens to the rejected part decides the cost. If someone looks at it and puts it back in the flow, you've lost a minute of labor and some handling. If the policy is to scrap anything the camera kicks out, which is common in regulated and safety-critical work, every false reject costs a full good part. At 2 percent with review, payback stretches from 12.3 to 17.3 months. With scrap at $8 a part, the station's $101,400 of other net savings is gone at about 1.07 percent.
That's the arithmetic behind a story we hear a lot. The station catches every defect, rejects too many good parts, and operators find a way to bypass it within a month. False rejects rarely come from the camera alone. They come from lighting that can't separate a defect from texture, thresholds set during a demo on clean parts, and part variation nobody showed the vendor. We go through causes and fixes in vision system false rejects, and the machine vision lighting guide covers the most common root cause.
Use your numbers, not ours
Every input marked illustrative is a placeholder. Swap in your own defect rate, escape cost and inspection hours from quality records before you show this to finance. If you can't find an escape cost, that's a finding in itself. The case will then be argued on labor alone, and on a busy line labor's usually the smallest of the three savings.
What costs do vision ROI calculations usually miss?
The ones we see left out most are validation, your own engineering and downtime, recipe changes for new part numbers, model retraining on deep learning stations, and the labor to handle the reject bin. Leave them out and the payback looks months shorter than it'll be.
Validation means building and labeling a test set, running it and writing up the result. For a measurement or attribute check, a study in the style of AIAG's Measurement Systems Analysis manual is the evidence most quality teams ask for.5 Our post on vision system validation sets out the protocol. Change is the other quiet cost. Every new part number or supplier switch is a job edit, and deep learning stations also need images collected and models retrained now and then. The deep learning vs rule-based vision guide covers how upkeep differs between the two, and the machine vision maintenance checklist turns it into a routine.
If the camera sits inside a robot cell, a lot of this is shared with the cell, including guarding, controls, validation and the operator screen. That can shrink the vision share of the project. Our machine vision capability page explains how we scope vision as part of a cell, and the on-premise AI capability covers running inspection models on the plant floor.
Where does machine vision ROI come from by application?
It depends on the job. Assembly checks earn it on escapes, cosmetic inspection on labor and false rejects, gauging on catching drift early, and code reading on traceability. Know which one your case rests on before you build the spreadsheet.
On assembly verification, a missing clip or wrong connector that reaches your customer is expensive, so escapes carry the case. On surface defect inspection, people are slow and cameras tend to over-reject, so labor and false rejects decide it. Dimensional gauging pays by spotting drift before parts go out of tolerance, which is closer to prevention than appraisal. And with OCR and code reading, the value is traceability and not shipping the wrong label.
How do you build a business case for machine vision?
Measure the current process, price an escape and a false reject from your own records, get a line-item quote, add internal costs and upkeep, then run the payback and a sensitivity check. Finally, write the targets into acceptance so the case can be checked after go-live.
- Measure the defect rate, manual hit rate and false-reject rate with a blind test, and inspection hours from time records.
- Pull the last year of complaints and corrective actions and average the real cost of an escape.
- Decide whether rejects get reviewed or scrapped, and cost that policy.
- Get a line-item quote for hardware, software, engineering hours, validation, training and spares.
- Add your own engineering time and install downtime.
- Add yearly upkeep for spares, software fees, recipe changes and retraining.
- Compute net annual savings and simple payback, then add a ramp-up period.
- Move each input to a plausible bad value. If the case only works at the optimistic end of one input, get better data for that input.
- Write the catch rate and false-reject rate into acceptance, tested on your labeled parts.
- Check actual reject rates and escapes against the case six months after go-live.
If this is your first station, starting your first machine vision project covers what to do before any of this, and the inspection system comparison lays out the options side by side. For every application and what it takes to do well, browse the machine vision library.
Frequently asked questions
How accurate is manual visual inspection?
Less accurate than most plants assume. A Sandia National Laboratories study of precision manufactured parts found inspectors correctly rejected 85 percent of defective items and wrongly rejected 35 percent of acceptable parts. Results vary a lot by task, so measure your own inspectors with a blind labeled set, but don't use 100 percent as your baseline.
What is the difference between ROI and payback period?
Payback is how many months it takes cumulative savings to equal the investment. ROI is the value the station creates over a longer period, usually three to five years, as a percentage of what you spent. Finance teams often screen on payback first, because it's simple and it punishes optimistic long-term guesses.
Does machine vision pay off on low-volume lines?
Sometimes. On low-volume lines the labor saved is small, so the case rests on what an escape costs. If one escaped defect can trigger a recall, a line stop at your customer or a regulatory event, a station can pay for itself on avoided escapes alone. If escapes are cheap and the check takes seconds, it usually won't.
How do you measure your escape rate before buying a vision system?
Pull a year of customer complaints, returns and corrective actions and count the defects that reached the customer, against the parts you shipped. Then seed a labeled set of known-bad parts into normal production and see how many your current inspection catches. The two numbers together give you a defensible baseline for the ROI.
Is AI inspection ROI different from rule-based vision ROI?
The math is the same, but the inputs differ. AI inspection usually costs more up front for image collection and labeling, and it adds a recurring retraining cost. It often earns that back on cosmetic or variable defects where rule-based tools either miss defects or over-reject good parts, which shows up as a lower false-reject cost.
Should throughput gains count in a vision ROI?
Only if you can sell or use the extra output. If manual inspection is the bottleneck and the line has orders waiting, the freed capacity is real money and belongs in the case. If the line is limited elsewhere, faster inspection just moves the queue, so leave it out and mention it as upside.
Sources
- ASQ, What is Cost of Quality (COQ)?, accessed October 2026. Defines prevention, appraisal, internal failure and external failure costs, and cites the 2025 ASQE Insights on Excellence Cost of Quality Report (31 percent of respondents feel they fully understand the financial impact of quality costs). Read the page.
- See, J. E., Visual inspection reliability for precision manufactured parts, Human Factors 57(8), 1427–1442, 2015. Sandia National Laboratories. Inspectors correctly rejected 85 percent of defective items and incorrectly rejected 35 percent of acceptable parts. View the publication record.
- U.S. Bureau of Labor Statistics, Quality Control Inspectors, Occupational Outlook Handbook. Median pay $23.35 per hour, May 2025. Read the profile.
- U.S. Bureau of Labor Statistics, Employer Costs for Employee Compensation, June 2026. Private industry: total compensation $46.89 per hour, wages and salaries $32.82 (70.0 percent), benefits 30.0 percent. Read the release.
- AIAG, Measurement Systems Analysis (MSA), 4th Edition, 2010. Reference manual for measurement and attribute studies used in automotive and wider manufacturing quality systems. View the manual.
- KEYENCE America, AI Inspection ROI: How to Understand the Payback Period for AI Machine Vision, 2026. Defines payback as the months for cumulative savings to equal the total investment and names a weak baseline as the most common cause of a disappointing ROI estimate. Read the article.
- Nello Zuech, Cost Justification Strategies for Machine Vision, Association for Advancing Automation (A3), undated. Notes that direct labor costs can easily amount to 1.5 times an employee's hourly rate. Read the article.
The worked example is illustrative. Volumes, defect rates, escape and false-reject costs, catch rate, project cost and upkeep are placeholders chosen to show the method, not data from a customer or a Relling deployment. The labor rate, manual hit rate and cost of quality categories are sourced as cited. The practices we recommend (counting only freed hours, pricing false rejects, writing both rates into acceptance) come from our experience and are offered as such.
Read next
 Machine vision
 system cost in 2026
Real prices by tier, the full station cost stack, and how to compare quotes.
23 October 2026↗ Machine vision
Vision system false rejects
The usual causes, how to diagnose them, and fixes that don't let defects through.
Series↗ Machine vision
Manual vs automated visual inspection
Where people still win, where cameras do, and how to measure both fairly.
Series↗Have us check your vision business case.Bring Relling to your shop floor.
We started Relling to help American manufacturers make more of what this country needs. Tell us about the part and we'll scope a cell to it.