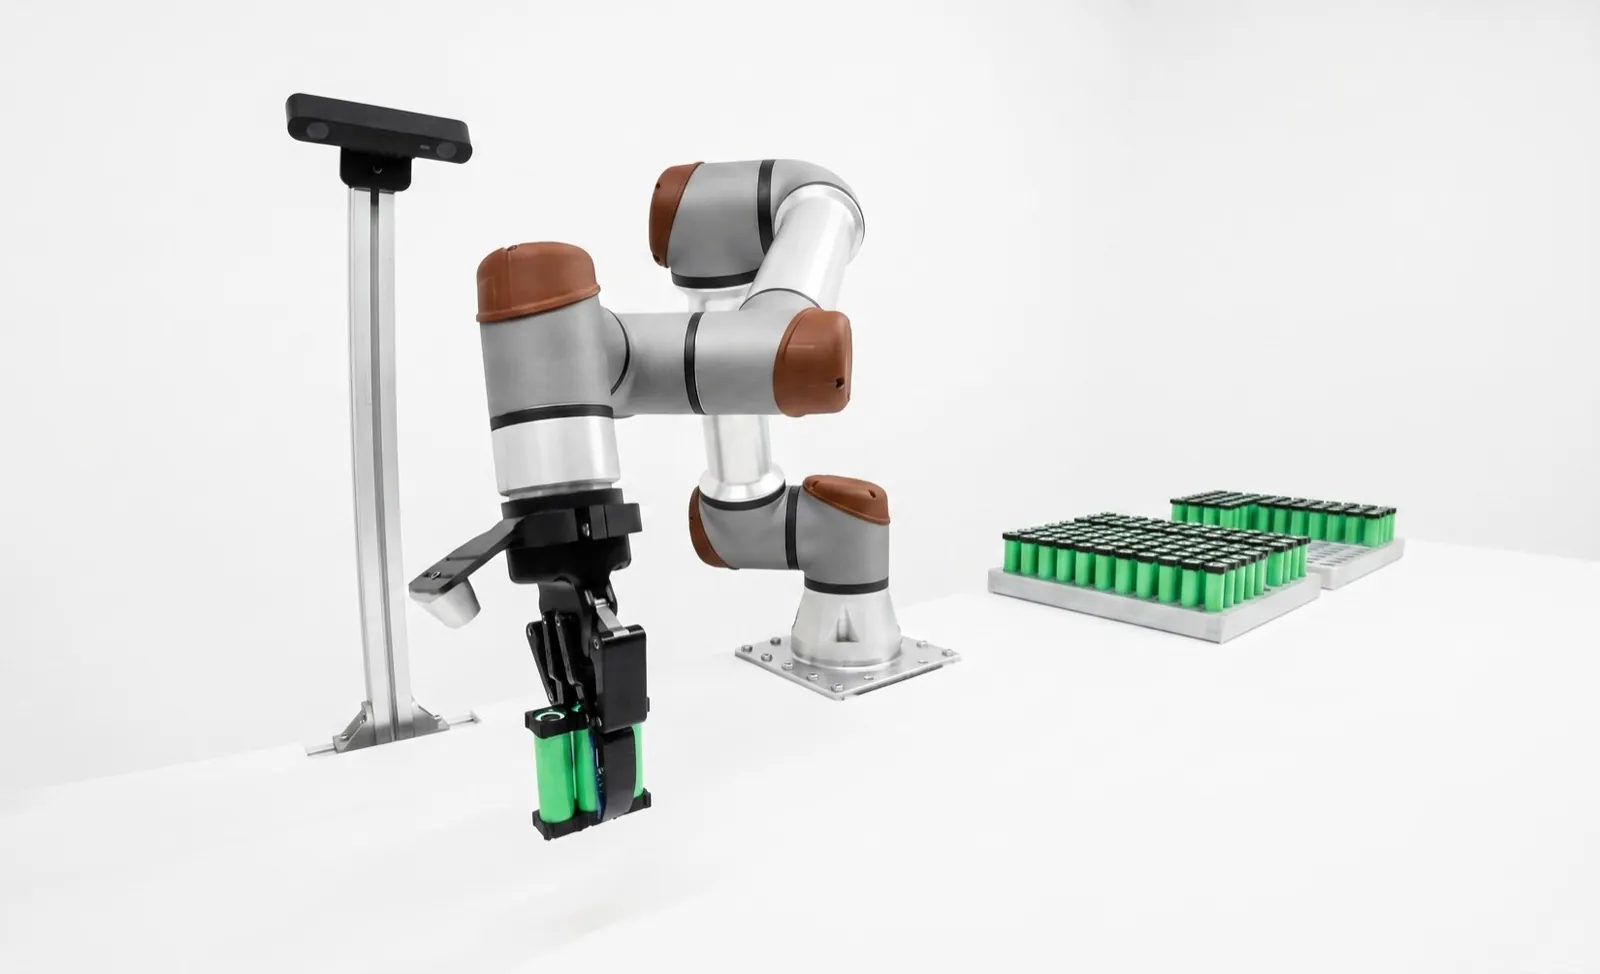
Manual vs automated visual inspection: what the research says about people, and when cameras win.
Trained inspectors working carefully catch about 80 to 85 percent of defects, and they get worse with time on task and with rare defects. Cameras don't tire, but they only find what they were set up to find. Most lines do best with vision doing the search and people making the hard calls.
On this page
In manual vs automated visual inspection, the honest comparison is this. Careful human inspectors miss something like 15 to 20 percent of defects, and more when defects are rare or the shift is long. Automated inspection is consistent and keeps a record of every part, but it only catches defects it was built to look for. People still win on novel defects, judgment calls and low volumes.
That's the short version. The longer one matters because most plants don't actually know their own inspectors' hit rate, and they make the automation decision on gut feel. We build robotic cells with machine vision applications inside them, so you'd expect us to say "automate everything." We won't. This post is about the human side of the decision. If you want the method-by-method comparison of people, cameras and coordinate measuring machines, see our page on manual vs machine vision vs CMM instead.
Key takeaways
- In a Sandia study of 82 experienced inspectors, they caught 85% of defective parts and rejected 35% of good ones.
- 100% visual inspection isn't 100% effective. Rare defects, long sessions and fast pacing all raise the miss rate.
- Accuracy falls quickly with time on task. The research supports breaks or task rotation about every 30 minutes.
- Humans still beat cameras on new defect types, ambiguous cosmetic calls and low-volume, high-mix work.
- The strongest setups are hybrid. Vision searches every part, and a person reviews what it rejects.
How accurate is human visual inspection?
Human visual inspection typically catches 70 to 85 percent of defects. Sandia's 2015 study of 82 experienced inspectors found they correctly rejected 85 percent of defective parts but also rejected 35 percent of good ones. Older studies report detection anywhere from about half to nearly all defects, depending on the task.
The best modern number comes from Judi See at Sandia National Laboratories. Eighty-two inspectors from the U.S. Nuclear Security Enterprise each inspected 140 precision parts for eight kinds of defect, under normal shop lighting and without magnification.2 They caught 85 percent of defective items on average (95 percent confidence interval 82 to 87). That's a bit better than the 80 percent figure often quoted for industry, but the confidence interval didn't come close to 90. And they paid for it. They rejected 35 percent of acceptable parts, where false alarms in the literature usually run 1 to 10 percent.2
Read that twice if you run a manual inspection station. These were experienced, careful people inspecting parts where the stakes are about as high as manufacturing gets. They still missed roughly one defect in seven, and they scrapped a lot of good product to get there.
See's earlier literature review for Sandia collects decades of studies, and the spread is wide.1 Reported defect detection runs from 9 to 64 percent for measuring dimensions, 67 percent for surface defects on piston rings, 68 percent for aircraft visual inspection and 52 percent for routine highway bridge inspection. Error rates of 20 to 30 percent, the review notes, are frequently quoted across many kinds of inspection.1
Is 100% visual inspection effective?
No, not fully. Inspecting every part by eye still lets defects through, because each inspector misses some fraction and the misses aren't random. Sandia's review states plainly that even under 100 percent inspection, not all defects are detected. Adding a second inspector helps less than the arithmetic suggests.
You'll often hear that "100 percent inspection is about 80 percent effective," usually attributed to Joseph Juran. We couldn't find that line in a primary source, so we don't quote it. The underlying point holds up, though, and you don't need Juran for it. The measured data above says one pass by a good inspector finds most defects, not all of them.1
So why not add a second inspector? Here's the tempting arithmetic. If each inspector catches 85 percent independently, both miss the same defect only 0.15 × 0.15 = 2.25 percent of the time, so two in series would catch 97.75 percent. Two problems. First, misses aren't independent. The hard defects are hard for everyone, and in the 2015 study the detection rate for individual defective parts ranged from 37 to 100 percent.2 Second, if a part's rejected when either inspector rejects it, false rejects stack too. At 35 percent each, a good part survives both only 0.65 × 0.65 = 42.25 percent of the time.
That second number's the one people forget. Research on two-inspector schemes summarized in the Sandia review found the best discrimination came when two inspectors look at every item and both must reject it before it's called defective.1 In other words, a second look works best as a check on rejects, not as a second chance to reject. Hold onto that idea. It's the logic behind the hybrid setup later in this post.
Why do human inspectors miss defects?
Mostly because defects are rare, the eye never lands on them, or the inspector is rushed or tired. When defects are rare, people stop searching sooner. Faster pacing raises misses, and individual inspectors vary widely. Most errors are misses, not false alarms, and most misses happen during search rather than the final decision.
The rare-defect problem has a name, the prevalence effect, and the cleanest demonstration of it is a short paper in Nature by Jeremy Wolfe and colleagues.4 Observers searched simulated baggage X-ray images for tools. When a target was present in half the images, they missed 7 percent. At 10 percent prevalence they missed 16 percent. At 1 percent prevalence they missed 30 percent. Same people, same targets. The only change was how often the thing showed up.
Here's why that matters on your floor. The better your process, the rarer your defects, and the worse a human gets at catching the few that remain. A line running at half a percent defective is exactly where manual inspection is weakest.
Speed hurts too. In a study the Sandia review cites, doubling the normal inspection rate raised misses from 23 to 30 percent.1 And people differ more than managers assume. One early study found individual inspectors' detection of solder defects ranged from 43 to 100 percent, and in another, 23 percent of decisions were reversed when the same piston rings were inspected a second time.1 An FAA benchmark study of twelve airline inspectors on the same Boeing 737 found substantial inspector-to-inspector variation, and found that the search part of the task drove performance more than the decision part.5
That last finding is the key to the whole hybrid argument. People are good at deciding. They're worse at searching every square millimeter of every part, all shift long.
How long can an inspector inspect before accuracy drops?
Not long. Vigilance research shows detection falls over the first half hour of continuous inspection, with most of the loss inside the first 15 to 35 minutes. Sandia's review recommends inspecting no more than about 30 minutes at a time, then taking a short break or switching tasks.
The research goes back to Norman Mackworth's work for the Royal Air Force in the 1940s, after radar operators started missing submarines a half hour into their watch. The decline he found, the vigilance decrement, has been replicated for decades. According to the review, it's typically complete 20 to 35 minutes into a session, with at least half the loss in the first 15 minutes.1 In inspection studies the losses are large. One industrial review noted detection could deteriorate up to 40 percent in 30 minutes, a study of rubber seal inspectors found a 27 percent drop in hits from the first 15 minutes to the second, and field studies of aircraft inspectors reported drops of 13 to 45 percent with time on task.1
The practical guidance is consistent. Sandia's review recommends that inspectors spend no more than 30 minutes at a time inspecting parts, with a short break or a different task in between.1 A later panel paper by See, Colin Drury and colleagues adds a two-hour ceiling on continuous inspection to prevent vigilance losses.3 And it isn't just boredom. Warm, Parasuraman and Matthews' review in Human Factors found that vigilance takes hard mental work and is stressful.6
Now look at a typical manual inspection station on second shift. One person, a stool, a lighted magnifier and eight hours. You don't need a study to guess the hit rate in hour seven.
Where do humans still beat machine vision?
On defects nobody has seen before, on judgment calls where the standard is fuzzy, and on low-volume, high-mix work where programming a camera for each part costs more than the inspection. People also generalize from one example, handle parts in awkward orientations and notice when something's just off.
The Sandia review puts it neatly. Humans are better than machines with novel situations, perceiving patterns and generalizing from single cases, and machines are better at repetitive, routine work.1 A camera set up to find scratches won't flag the wrong-color part your supplier shipped without telling anyone. A person usually will, even if nobody trained them for it.
Here's where we'd keep people in the loop, without hesitation.
- New products and early production, when you don't yet know what the defects look like and couldn't build a vision job if you tried.
- Cosmetic grading where the acceptance standard is a conversation, not a number. If two of your senior inspectors disagree about a part, a camera won't settle it.
- Very low volumes and frequent changeovers, where setting up and validating a job per part number costs more than the labor.
- Large or awkward parts that a person can turn over in seconds but would need a robot and several cameras to view fully.
AI inspection narrows some of these gaps, especially on cosmetic surfaces. It doesn't close the first one. A model trained on last year's defects is still blind to the defect that appeared this morning. Our post on AI visual inspection on a real line covers where deep learning genuinely helps, and our guide to surface defect inspection shows what it takes to light and image those defects well.
How does automated optical inspection compare to manual inspection?
Automated optical inspection is far more consistent than a person. It checks every part the same way at line speed and logs an image and a result for each one. But it only finds what it was programmed or trained to find, and it still makes errors. Manual inspection is flexible and cheap to start, and less repeatable.
The research is careful on this point. See and colleagues note that automated optical inspection reduces variation in inspection but doesn't eliminate error.3 And automation changes the human job rather than removing it. When a machine does the searching, the person's role can shift from active inspection to passively monitoring the machine, and that makes vigilance effects worse, not better.3 A quality tech who watches a green light for six hours isn't really checking anything.
The table below is the comparison we use with customers. It's deliberately about people and process, not equipment. For hardware, cycle time and measurement capability, the manual vs machine vision vs CMM comparison goes method by method.
| Factor | Manual inspector | Automated vision |
|---|---|---|
| Detection on known defects | About 80–85% for careful, experienced inspectors2 | Set by the job and validated on a test set; doesn't fade |
| Consistency | Varies by person, hour and day1 | Same result for the same image |
| Rare defects | Missed more as they get rarer4 | Unaffected by defect rate |
| New or unexpected defects | Often noticed | Usually missed unless the job looks for them |
| Judgment on ambiguous parts | Strong, if the standard's clear | Weak unless the rule or labels are clear |
| False rejects | Can run high when inspectors play safe2 | Tunable, and visible in the data |
| Record per part | Usually a tally sheet | Image and result for every part |
| Start-up cost and change | Low; retrain a person in a day | Higher; each new part needs a job and validation |
What is a hybrid inspection setup?
A hybrid inspection setup lets the vision system inspect every part and sends only its rejects, and sometimes a small random sample of passes, to a person for review. The camera does the tiring search. The human makes the final call on a few parts, with time to look properly.
This isn't our invention. It follows directly from the research. Drury and Watson, as summarized in the Sandia review, argued that search should go to the machine and decisions to the human, because people are better at deciding than at searching.1 Earlier work found neither unaided humans nor full automation effective on its own, while combinations of people, sensors and computers usually beat any one of them.3 And the two-inspector findings point the same way. A second look is most useful as a check on rejects.
Three details make or break it on a real line. The reviewer has to see the image the camera saw, not just the part, or they can't tell why it was flagged. The review bench needs better light and more time per part than the line ever gave the old manual station. And somebody has to own the loop, because false rejects that get waved through without being logged teach the station nothing. Our post on why vision systems reject good parts covers the tuning side.
Keep a small random audit of passes too. It's the only way to estimate escapes, and it keeps the reviewer actively looking rather than just confirming what the machine said.
How do you compare the cost of manual and automated inspection?
Compare full annual costs, not just wages. On the manual side count loaded labor for every shift, the cost of escapes that reach customers and the good parts inspectors scrap. On the automated side count the installed station, maintenance, reject review time and recipe changes, then compare payback over the station's life.
The labor side is easy to underestimate. The BLS puts the median wage for quality control inspectors at $23.35 an hour as of May 2025.7 For an illustration, say benefits and overhead add 40 percent, so $23.35 × 1.4 ≈ $32.69 an hour. At 2,000 hours a year that's about $65,400 per inspector, and two shifts is about $130,800 a year. Your loading factor will differ, so use your own.
The quality side is where the decision usually swings, and it's the part people skip. If inspectors find 85 percent of defects, 15 percent of whatever you make bad reaches the next operation or the customer. Put a cost on one escape (a warranty claim, a line-down at your customer, a sorting charge) and multiply. Then count false rejects. The Sandia inspectors rejected 35 percent of good parts in a high-stakes setting.2 Your floor's probably nowhere near that, but even a few percent of good parts scrapped or reworked adds up fast at volume.
Don't forget the hybrid still has a human in it. Budget the reviewer's time, which on most stations we've commissioned is a fraction of a shift rather than a full one. Our walkthrough of machine vision ROI with a worked example runs the full payback math, and our guide to machine vision system cost covers the station side.
Manual vs automated visual inspection: which should you choose?
Automate when volume is high, defects are defined and repeatable, defects are rare enough that people miss them, or you need a record of every part. Keep manual inspection for new products, unclear standards and low-volume, high-mix work. For most lines in between, a hybrid of vision plus human review of rejects wins.
| Your situation | Lean | Why |
|---|---|---|
| High volume, defined defects, stable parts | Automated | Consistency and 100% coverage pay back fastest here |
| Very low defect rate on a good process | Automated or hybrid | People miss rare defects most4 |
| Cosmetic defects with a fuzzy standard | Hybrid | Vision flags, a person grades against a limit sample |
| Regulated, need a record per part | Automated or hybrid | An image and result per part beats a tally sheet |
| New product, defects still unknown | Manual, for now | You can't build a job for defects you haven't seen |
| Low volume, frequent part changes | Manual | Job setup and validation per part costs more than labor |
| Large parts, many faces, awkward handling | Manual or robotic vision cell | A robot can present each face to one camera |
If you land in the hybrid or automated rows, two pages will save you time. The machine vision lighting guide explains why most failed stations were lighting problems, and our post on validating a vision inspection station shows how to prove the camera beats the people it's replacing, with the same kind of seeded test set Sandia used. For assembly checks specifically, see assembly verification. If you'd like a cell built around the inspection, our machine vision capability page shows how we do it.
A note on the numbers
Detection rates come from published studies, and they vary a lot with the task, the defect and the setting. Several are lab studies, and the Sandia 2015 study used a much higher defect rate than most production lines. Treat them as evidence about how people inspect, not as a prediction for your station. The only way to know your number is to test your inspectors on seeded parts.
Frequently asked questions
Did Juran say 100% inspection is only 80% effective?
We couldn't find that line in any primary source, so we'd treat it as folklore. The idea behind it is well supported, though. Sandia's 2015 study measured 85 percent detection for experienced inspectors, and its review notes an 80 percent figure commonly quoted in industry. Cite the studies, not the quote.
How do you measure your inspectors' accuracy?
Build a seeded test set. Collect good parts and parts with each defect type, have your quality team agree on the correct call for each, and mix them in blind at a realistic defect rate. Score each inspector on defects caught and good parts rejected, and repeat the set later to check consistency. Attribute agreement analysis formalizes the same idea.
Can AI replace human visual inspectors?
For defined, repeatable defects at volume, AI and rule-based vision can do the searching better than people, because they don't tire or get worse when defects are rare. They don't replace judgment on new defects or unclear standards. In practice AI moves inspectors from searching every part to reviewing the few the system flags.
How do you train visual inspectors to catch more defects?
Show them many kinds of defect, not just the common ones, and use real parts as examples. Research summarized by Sandia found that training with a wide variety of defects improved detection of new ones, and that simple visual aids, like drawings with dimensions and tolerances, raised detection by 42 percent in one study of machined-parts inspectors.
Does better lighting improve manual inspection?
Yes, up to a point. Guidance cited in Sandia's review recommends about 500, 1,000 and 2,000 lux for ordinary, difficult and highly difficult inspection, well above typical office lighting of 300 to 500 lux. More light helps only until glare sets in, so directional and diffuse lighting matter as much as brightness.
What is automated visual inspection?
Automated visual inspection uses cameras, lighting and software to check parts for defects, presence, dimensions or codes without a person looking at each one. The system sends a pass or fail to the line, usually rejects bad parts automatically and stores the images. It ranges from a single vision sensor to multi-camera stations and robot cells.
Sources
- Judi E. See, Visual Inspection: A Review of the Literature, SAND2012-8590, Sandia National Laboratories, 2012. Reviews inspection research from the 1940s on, including Table 4 of observed detection rates, vigilance findings, break schedules, function allocation between people and machines, and two-inspector studies. OSTI record.
- Judi E. See, Visual inspection reliability for precision manufactured parts, Human Factors 57(8), 2015. Eighty-two inspectors, 140 parts, eight defect types; 85% of defective items correctly rejected (95% CI 82–87) and 35% of acceptable parts incorrectly rejected. DOI · OSTI record.
- Judi E. See, Colin G. Drury, Ann Speed, Allison Williams and Negar Khalandi, The role of visual inspection in the 21st century, Proceedings of the Human Factors and Ergonomics Society Annual Meeting, 2017. Panel paper on automation, hybrid inspection, AOI limits and a two-hour limit on continuous inspection. DOI.
- Jeremy M. Wolfe, Todd S. Horowitz and Naomi M. Kenner, Rare items often missed in visual searches, Nature 435, 439–440, 2005. Miss errors of 7% at 50% target prevalence, 16% at 10% and 30% at 1%. DOI.
- Floyd W. Spencer, Visual Inspection Research Project Report on Benchmark Inspections, DOT/FAA/AR-96/65, FAA Office of Aviation Research, 1996. Twelve airline inspectors on a Boeing 737; substantial inspector-to-inspector variation, with search the larger factor. Report record.
- Joel S. Warm, Raja Parasuraman and Gerald Matthews, Vigilance requires hard mental work and is stressful, Human Factors 50(3), 433–441, 2008. DOI.
- U.S. Bureau of Labor Statistics, Quality Control Inspectors, Occupational Outlook Handbook. Median pay $23.35 per hour, May 2025. Read the profile.
Inspection performance figures are sourced from the studies above; where we cite an older study through Sandia's 2012 review, the review is the source we checked. The labor loading factor, the Fig. 03 curve shape, the hybrid layout and the decision table are our illustrative examples and practice as an integrator, not survey data. The two-inspector figures are arithmetic shown in the text, not study results.
Read next
 Comparison
Manual vs machine vision vs CMM
The method-by-method comparison: speed, measurement capability and where each one fits.
Compare↗ Machine vision
How to calculate machine vision ROI, with a worked example
Put real numbers on escapes, false rejects and labor before you buy a camera.
23 October 2026↗ Machine vision
Validating a vision inspection station
IQ, OQ, PQ and gage R&R, and how to prove the camera beats the manual station.
23 October 2026↗Find out what your inspection station is really catching.Bring Relling to your shop floor.
We started Relling to help American manufacturers make more of what this country needs. Tell us about the part and we'll scope a cell to it.